GlycoCARTA
Files required for running glycoCARTA.
Use Case: Analyzing the gene expression profile of GDP-Fucose
- GDP-Fucose an essential precursor for glycosylation via fucose salvage pathway.
- GlycoEnzOnto has the functional annotation of GDP-Fucose which can be explored through glycoCARTA. glycoCARTA currently has pages for endothelial, stromal, epithelial and immune cells.
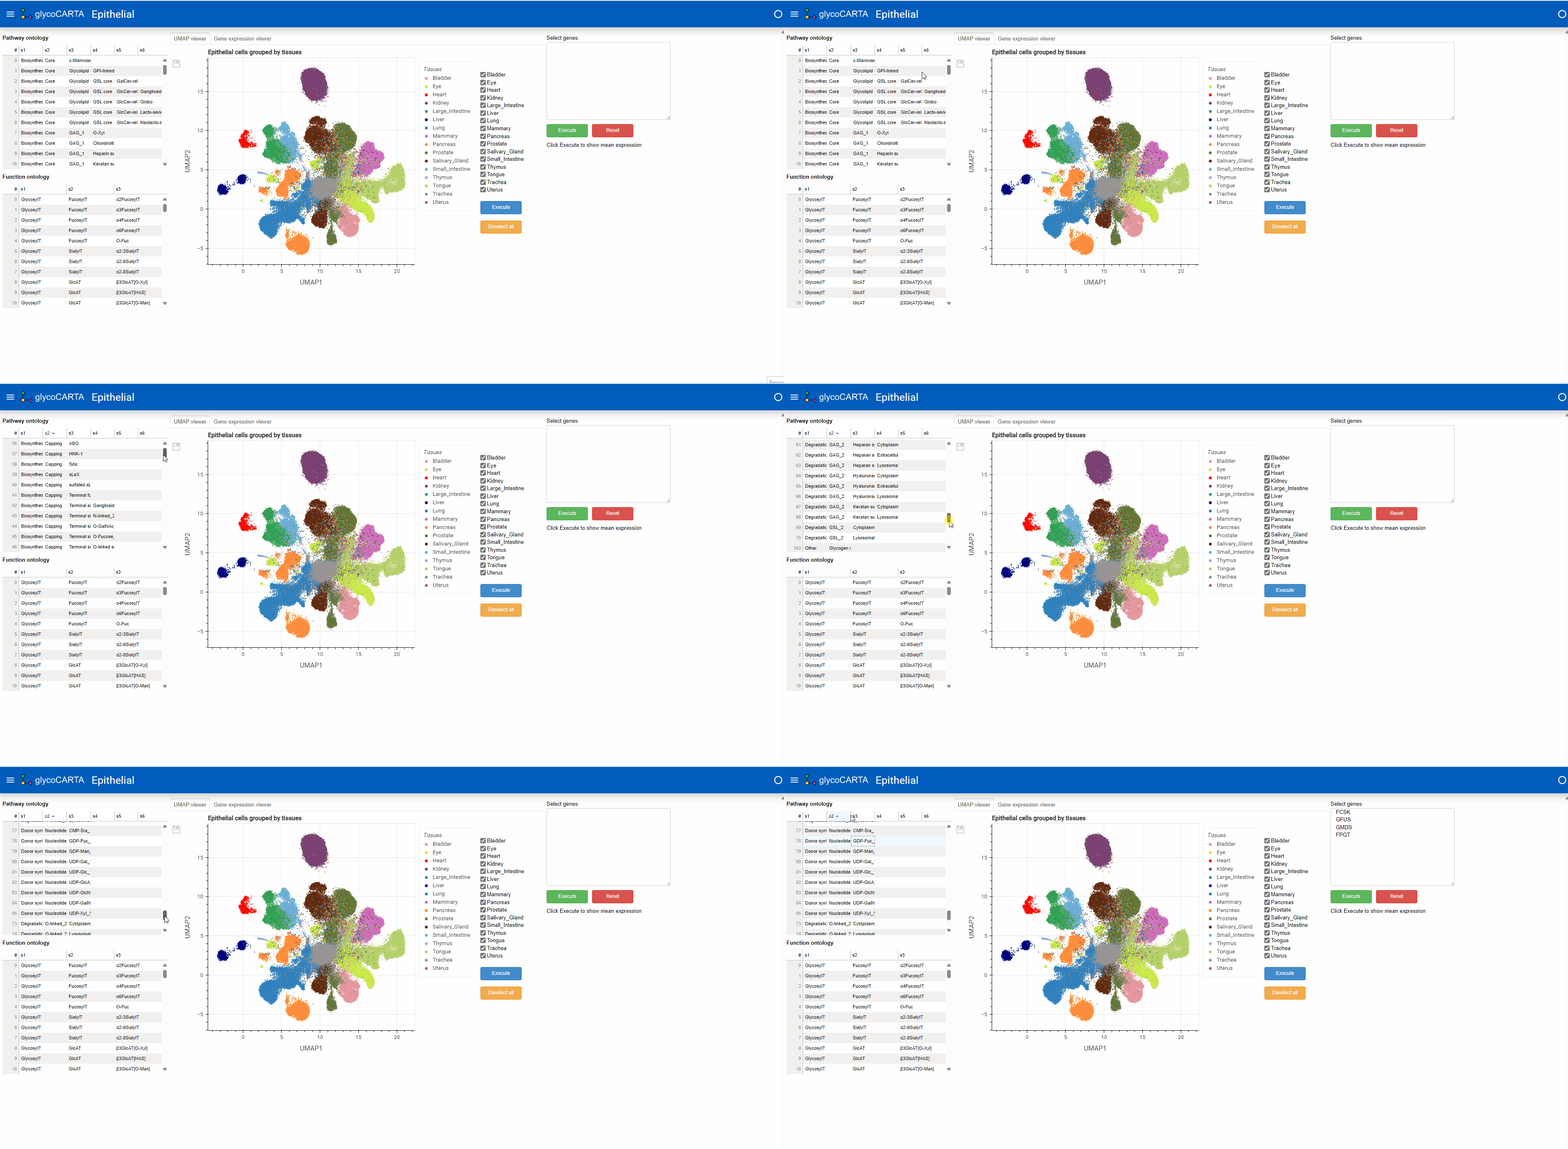
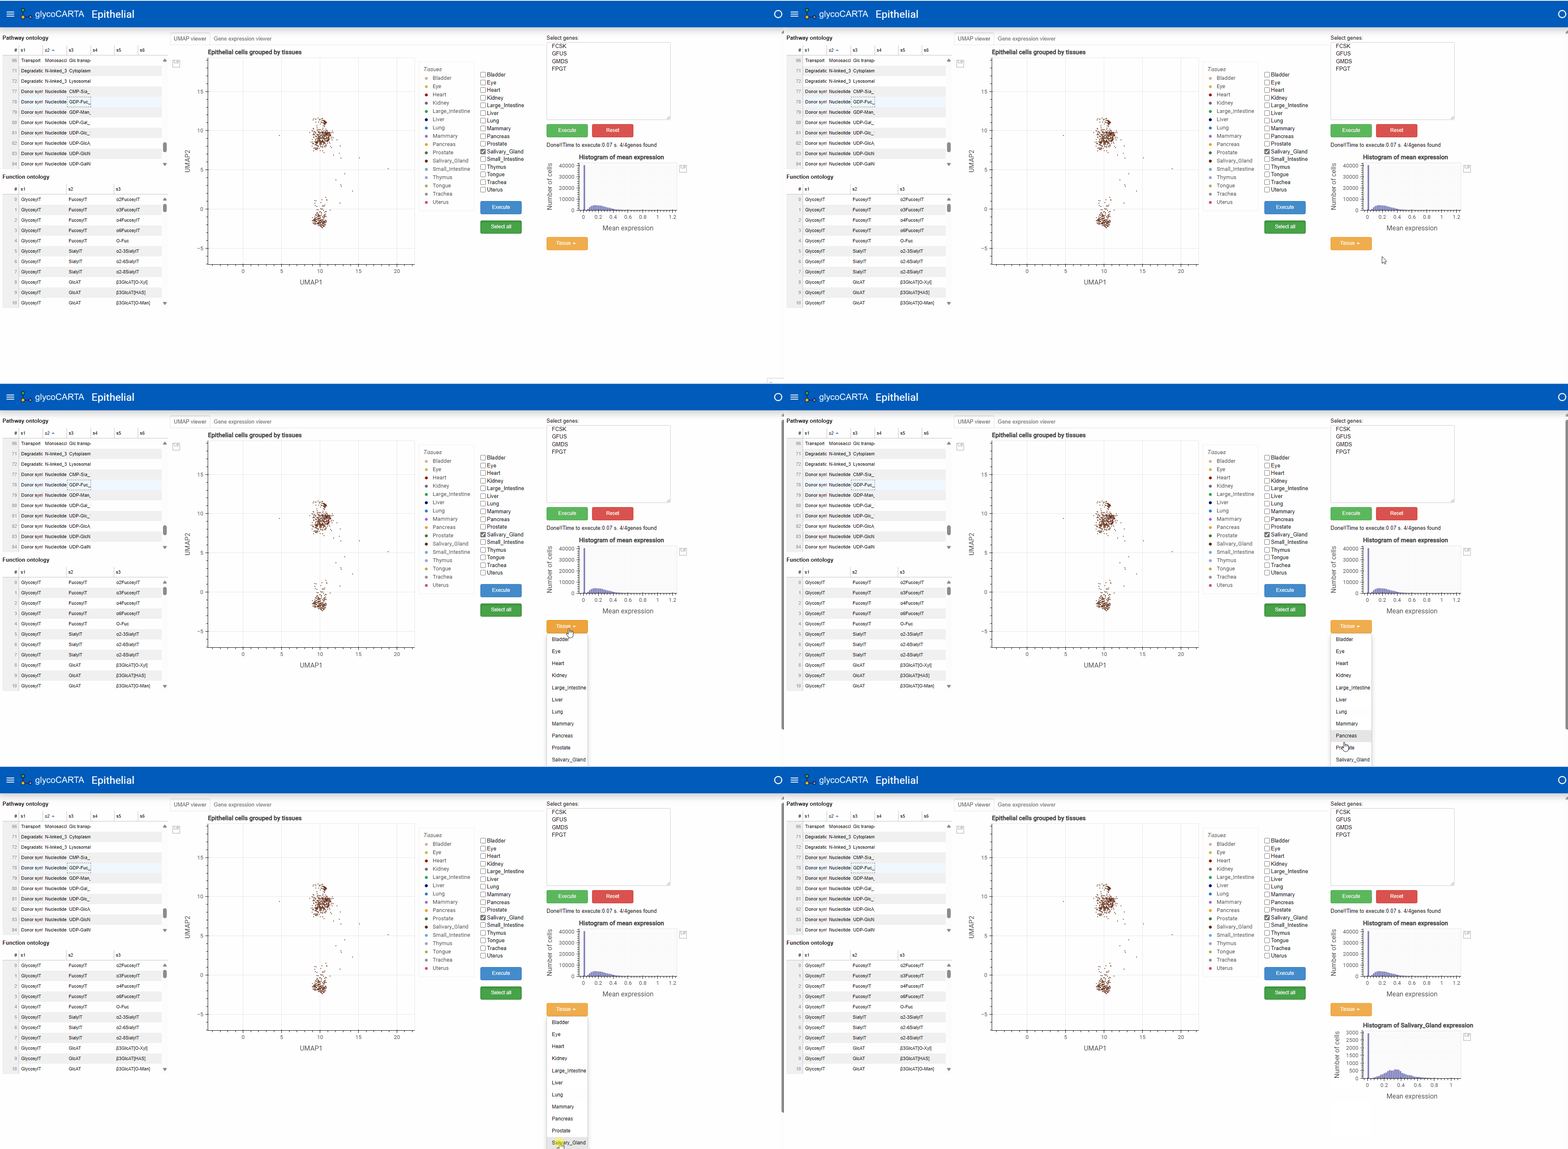
- The UMAP viewer shows the UMAP colored by the tissues available in TabulaSapiens.
- Genes can either be manually entered in column format (1 gene per line) in the text box or can be selected by either pathway or functional ontology to populate.
The Gene expression viewer can be used to show distribution of the mean expression of valid genes in the text box. The expreesion is log normalized.
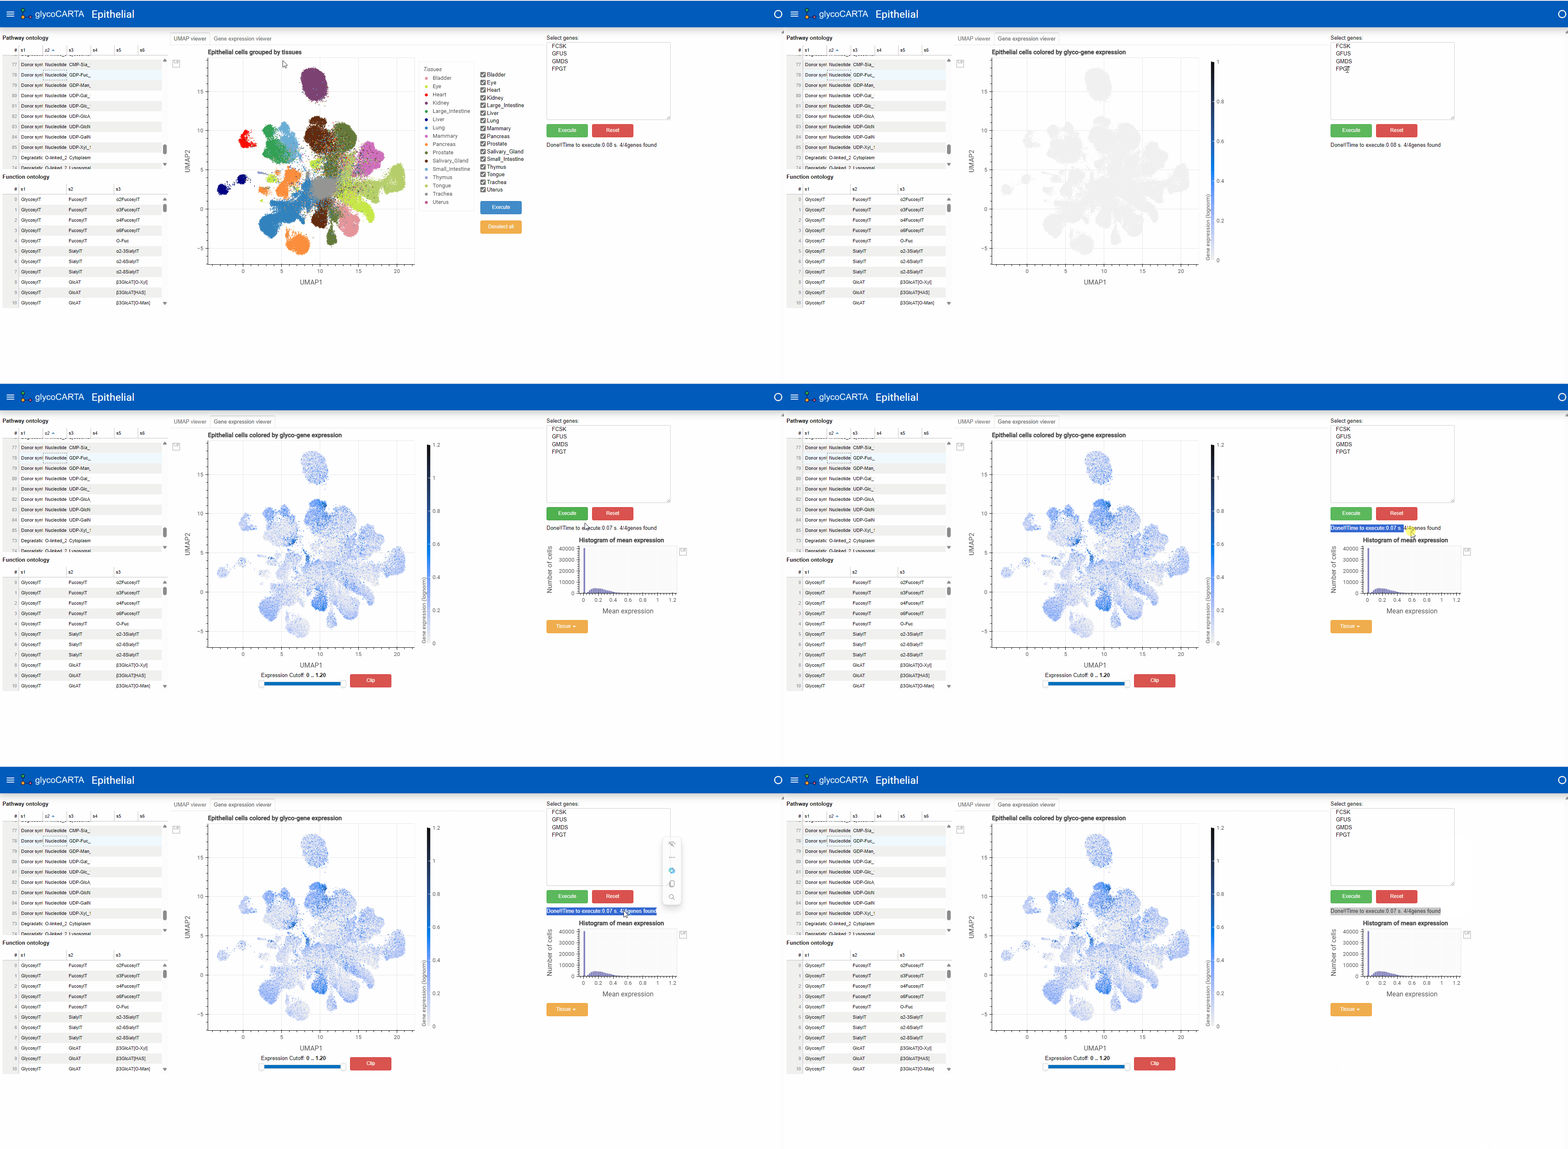
This can be further clipped by the expression values. Here, we filter the cells to only values which are atleast 50% (0.6) of the maximum expression (1.2).
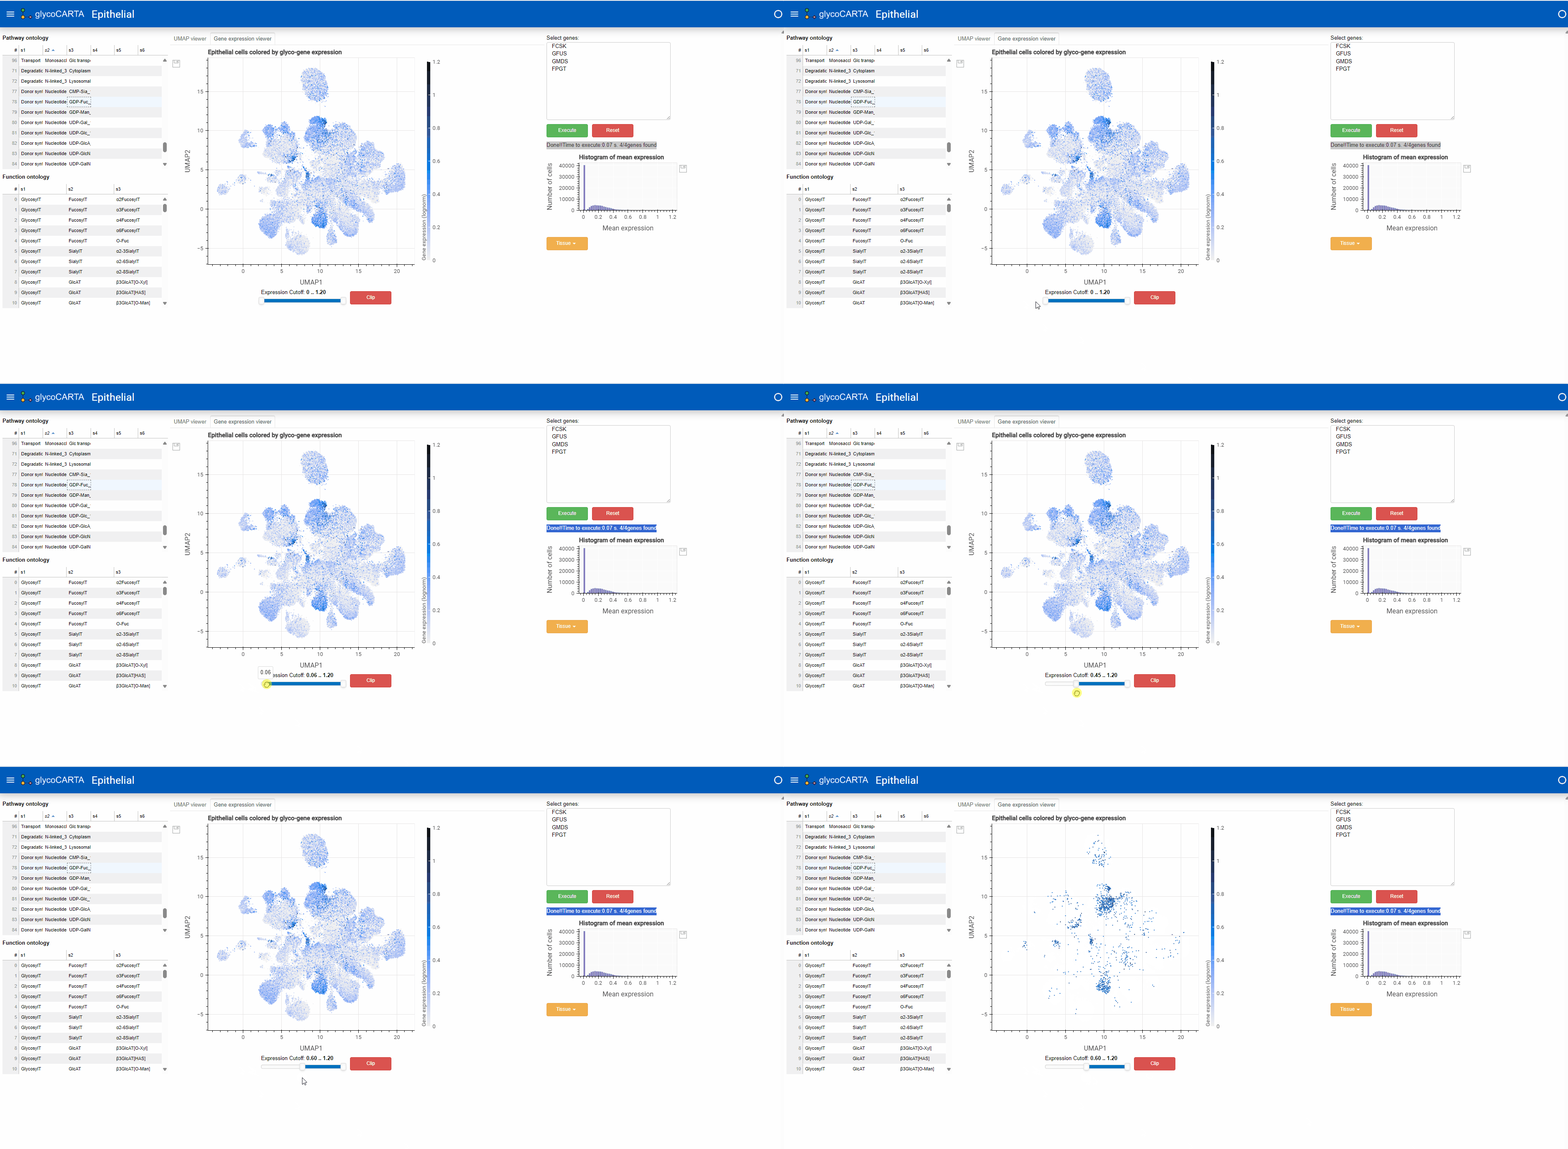
- Going back to the UMAP viewer, we observe that majority of the highly expressed epithelial cells belong to the Salivary Gland tissue.
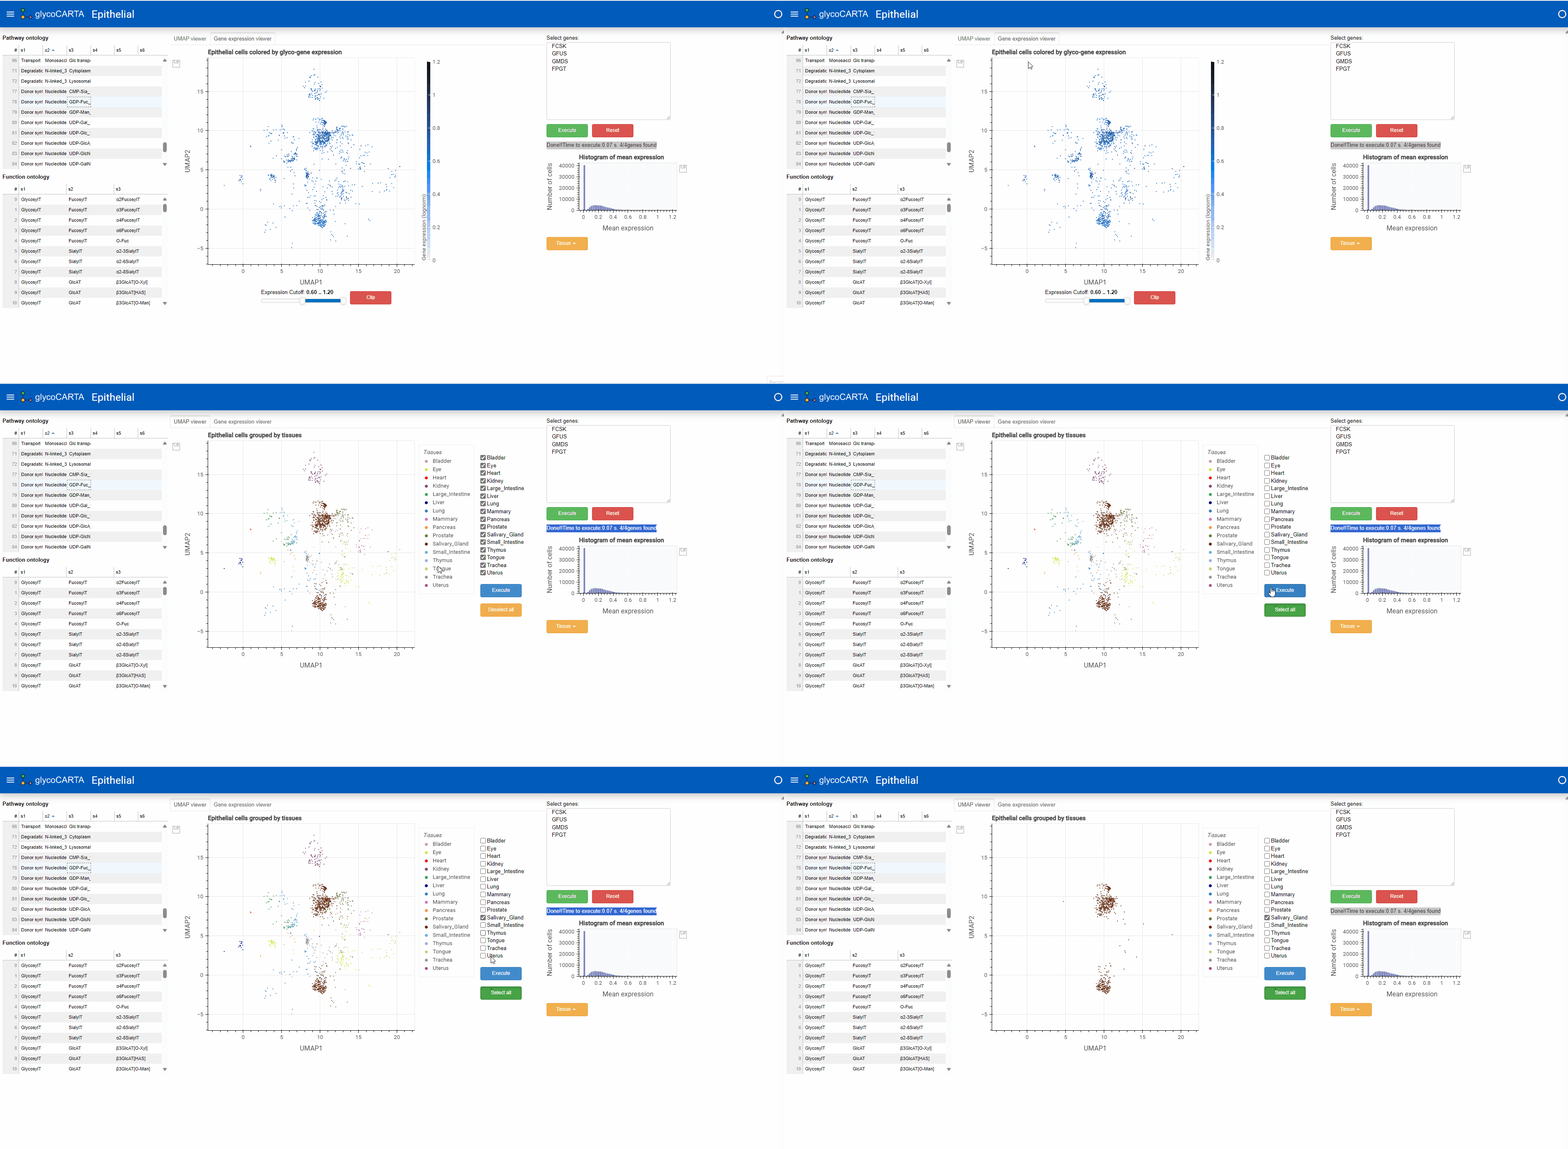
- We can observe the distribution of the expression through the histogram. The mode expression of cells (non-zero) is 0.4.
The transcription factors for these can be further check on glycoTF
- glycoTF can now be utilized to observe the top transcription factors relating to these genes.
- glycoTF utilizes the TFLinks database to analyze transcription factor-glycogene relations as supported by TabulaSapiens data.
- Here, we select the 4 genes corresponding to GDP-Fucose (FCSK, FPGT, GMDS, GFUS)
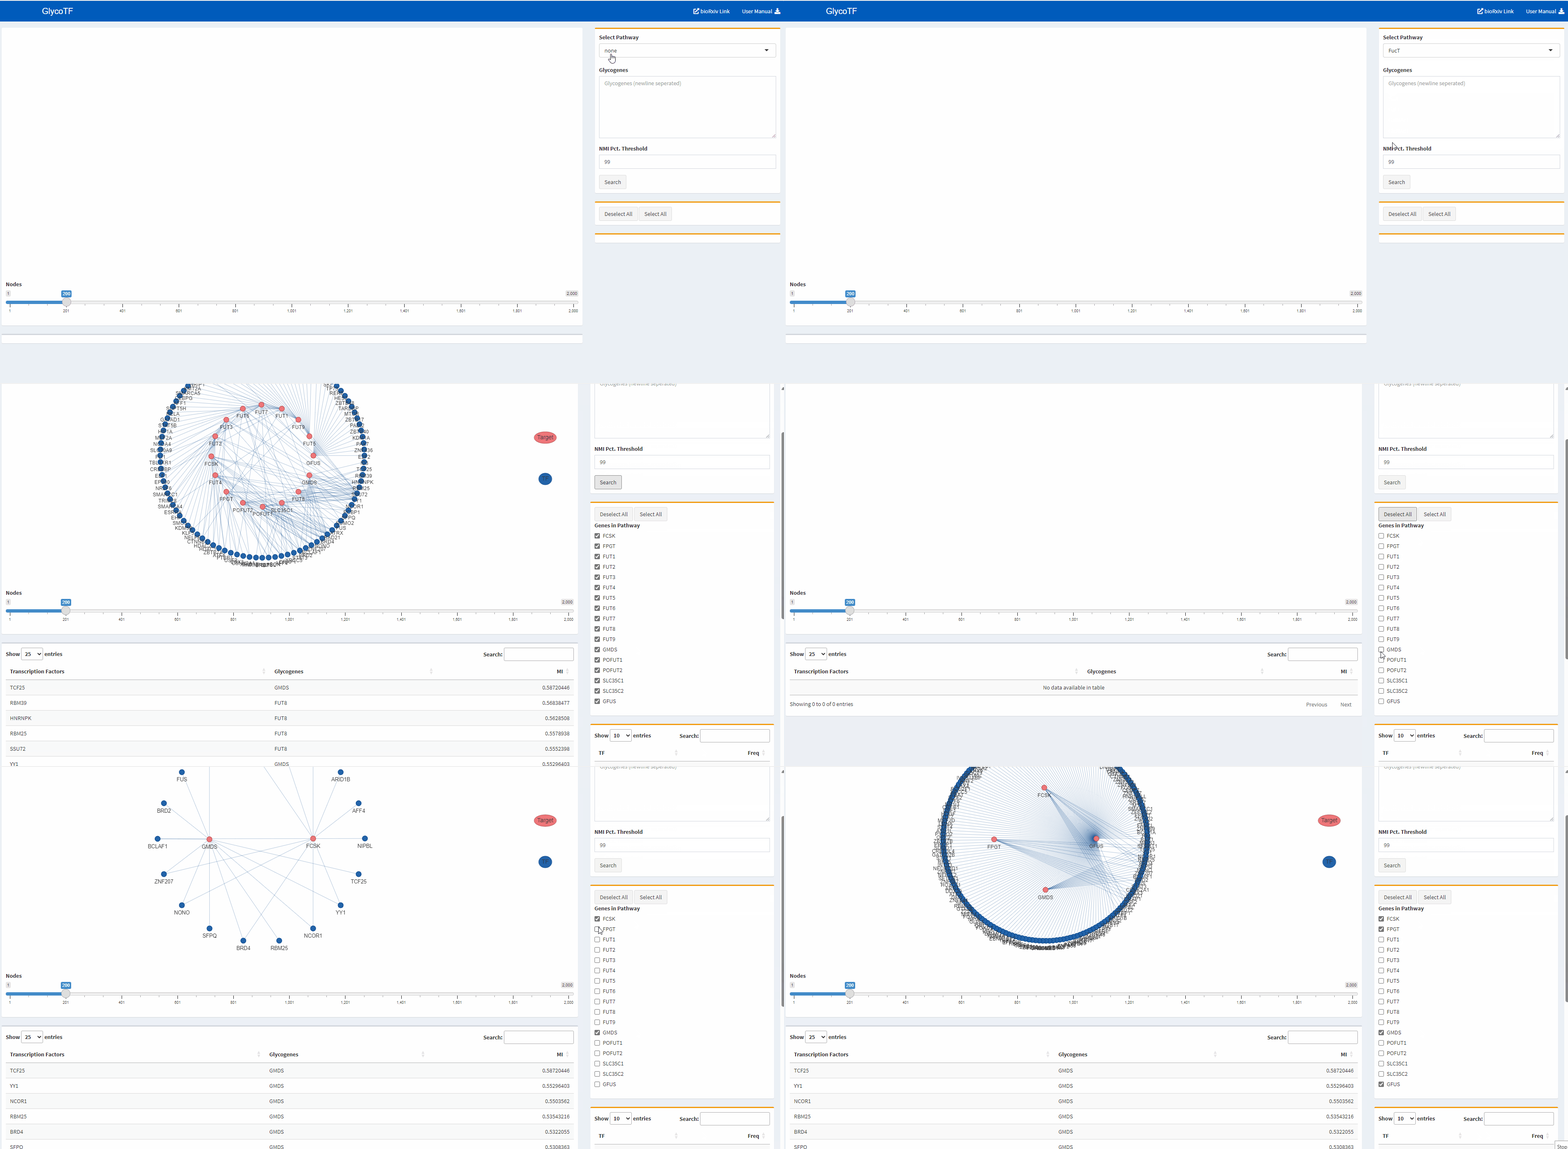
The pathway dropdown can be used to select glycogenes by pathways The textbox allows entering genes in column format (1 gene per row)
- The links in the graph currently show the top 200 TF-target links which cross the 99th percentile threshold of Normalized Mutual Information (NMI). A lot of the links have very low Normalized Mutual Information. So, we further filter these to just the top 20 nodes.
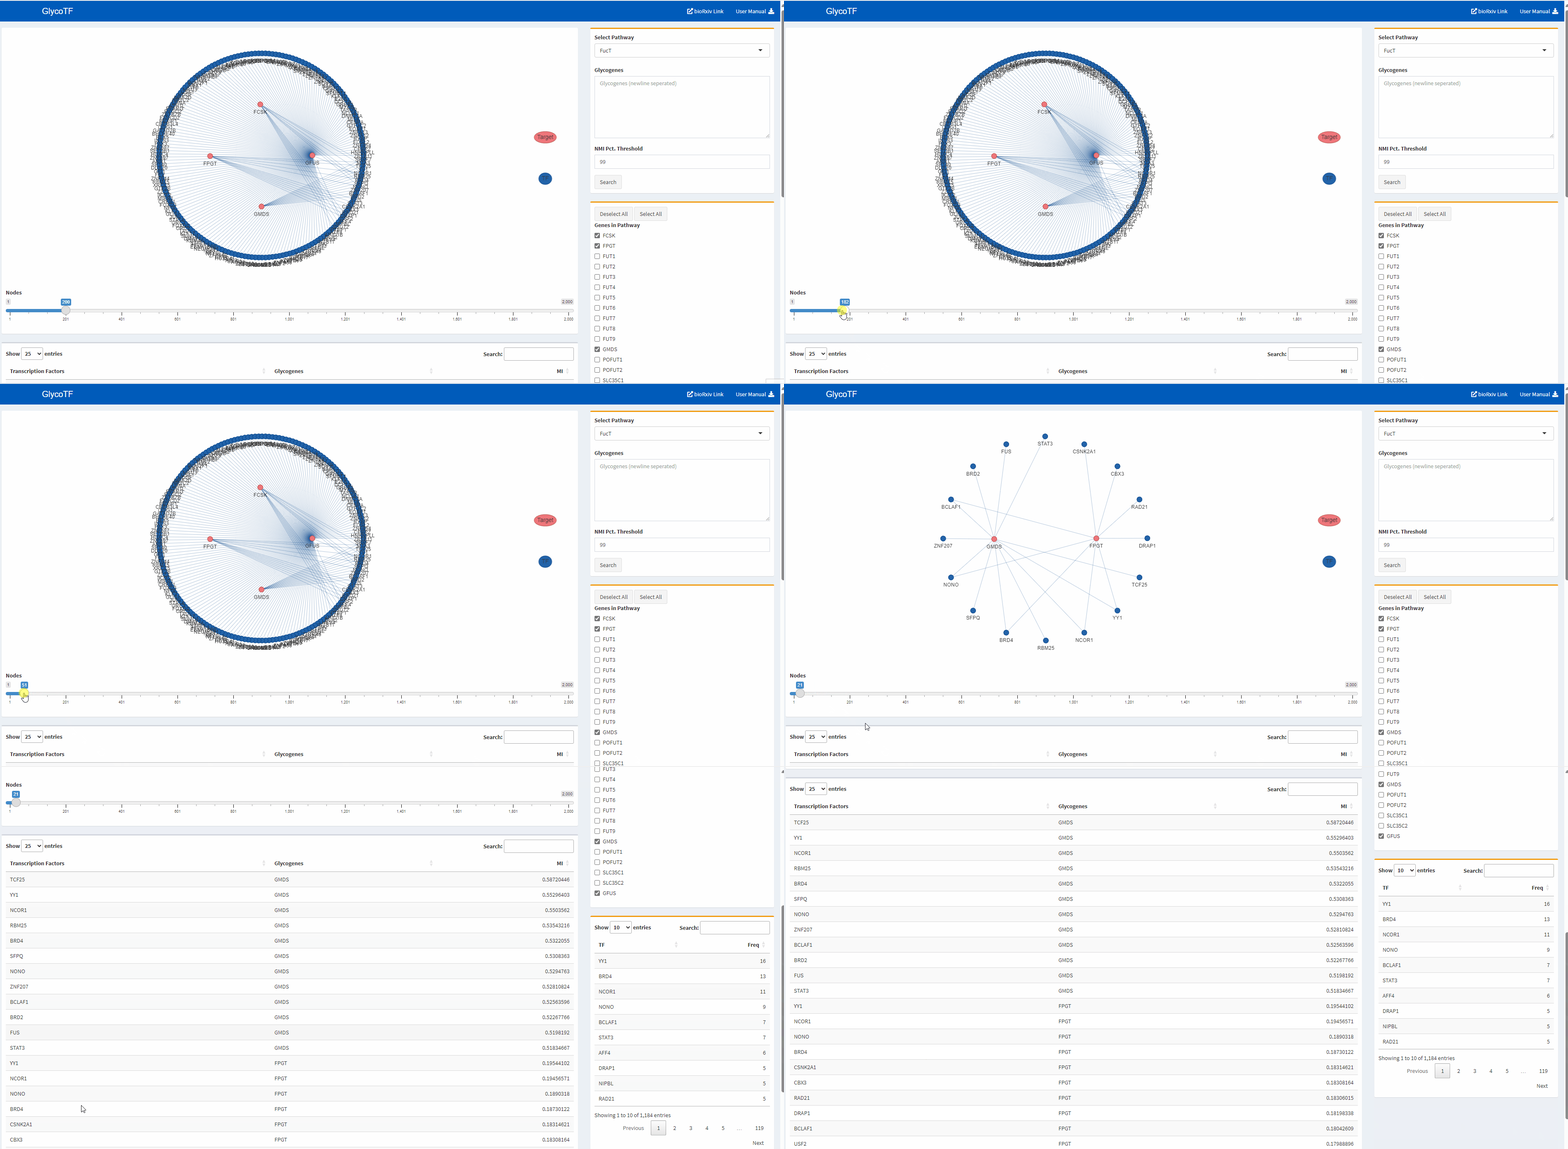
The table shows the TF-gene links with highest NMI. Only 12 links have NMI higher than 0.5 and all of them are with GMDS.